China unveils plans for two new gravitational-wave missions

China has revealed plans for two space-based missions to study gravitational waves. The National Space Science Center, Chinese Academy of Sciences (CAS), announced on 4 July that the country will launch a mission in 2020 to monitor gamma-ray bursts associated with gravitational-wave events. The CAS also gave the go-ahead for a fully-fledged gravitational-wave detector to be sent into space in 2033.

Gravitational waves are distortions of space–time that occur when massive bodies, such as black holes, are accelerated. Since their first direct detection in 2015 by the Laser Interferometer Gravitational-Wave Observatory (LIGO) detectors in Washington and Louisiana, scientists have since picked up several other events from the merger of black holes as well as neutron stars.

While scientists have the capability to detect such events, pinpointing their exact location is difficult with ground-based gravitational-wave detectors. This can be improved, however, by follow-up observations from ground- and space-based telescopes operating at various wavelengths. Gamma rays, for example, can play a unique role in this effort. During the merger of two neutron stars, a gamma-ray burst usually happens right after the generation of gravitational waves and before X-ray, optical and radio wavelengths can be detected.

Collaboration between China and Europe in space-based gravitational wave science is absolutely needed

Karsten Danzmann

“It’s like when you hear a thunderstorm, you look for lightning somewhere in the sky,” says Shaolin Xiong, a high-energy astrophysicist from the Institute of High Energy Physics in Beijing. “The lightning shows where the thunder is coming from”. Similarly, if scientists can associate a detected gamma-ray burst to a gravitational-wave event, they will be able to tell specifically which part of the sky it is happening and carry-out follow-up observations at other wavelengths.

Xiong is principal investigator for a new mission that will consist of two probes placed at opposite sides of the Earth to detect gamma-ray bursts in the energy range of 8 keV – 2 MeV. Dubbed the Gravitational wave high-energy Electromagnetic Counterpart All-sky Monitor (GECAM), it is now going through “phase A” study but the technical readiness for the mission is “high” according to Xiong. Once launched, the craft should begin operation in the second half of 2020, just when LIGO reaches its design sensitivity.

Space-based detection

A mission to directly detect gravitational-waves from space was also given the green light for further development by CAS. Low-frequency gravitational waves are inaccessible on Earth because ground-based interferometers would be required to have impossibly long arms. A space-based mission, however, could pick up gravitational-waves with frequencies between 10–4-10–1 Hz from, for example, the coalescence of supermassive black holes.

Dubbed TAIJI, the craft would detect gravitational waves from the merger of black holes and adopt a similar mission concept and technology with the European Space Agency’s LISA probe, which will launch around 2034 and consist of three spacecraft separated by 2.5 million km in a triangular formation, following Earth in its orbit around the Sun.

Like LISA, TAIJI would also place three craft in a triangular configuration in a sun-synchronous orbit with each side of the triangle instead being three million kilometers long. It will operate at a frequency range 0.01-1 Hz, and will focus on intermediate mass black-hole binaries.

TAIJI’s budget has not been revealed but it is considered to be at least 15 billion yuan ($2.26bn). China aims to first launch a “pathfinder” demonstrator craft around 2025 to test the technology behind TAIJI. “We’ve got good technology reserves and talent teams, and we are pushing forward at full speed to meet the timeline,” says Yueliang Wu, a theoretical physicist from the University of the Chinese Academy of Sciences who is TAIJI’s principal investigator.

China was invited to join LISA but its role was limited after NASA returned to the mission. While the community in China then decided to develop their own probe, it won’t stop researchers from the country working with their Europe counterparts. “Collaboration between China and Europe in space-based gravitational wave science is absolutely needed,” says Karsten Danzmann from the Max Planck Institute for Gravitational Physics in Hannover, who is also chair of the LISA consortium. “We’ll be happy to help with TAIJI pathfinder, for instance by organizing workshops in Europe.”
Paul Corkum bags Isaac Newton Medal from Institute of Physics

Paul Corkum has won the Isaac Newton Medal and Prize, which is awarded by the Institute of Physics (IOP) for “world-leading contributions to physics”. The Canadian physicist is based at the University of Ottawa, where he is National Research Council-Canada Research Chair in Attosecond Photonics.

“Isaac Newton was one of the greatest scientists to have ever lived, having laid the foundation for much of modern physics,” said Corkum, adding, “It is therefore a tremendous honour to receive a prize named after him. While I may be the first Canadian to win this award, I am surely not the last, as this is a golden age for Canadian science.”

Corkum is honoured for his pioneering work on creating ultrashort attosecond (10-18 s) laser pulses and using them to observe ultrafast chemical processes in real time. Working with the Hungarian physicist Ferenc Krausz, Corkum was the first to create 650 as pulses. Attosecond pulses have become an important tool for chemists and condensed-matter physicists because this is the timescale that that electrons move within atoms and molecules.

Corkum then went on to use ultrashort pulses to study a range of phenomena – developing techniques to obtain the first-ever real-time image of a molecular orbital and the first-ever space-time image of an attosecond pulse.

Debt to car repair

A native of St John, New Brunswick, Corkum began his career as a theoretical physicist by doing a PhD in at Lehigh University in the US. His dissertation was related to the physics of lasers and he soon found himself in the laboratory. “I was looking for a job when I completed my PhD studies and I was offered one in an experimental lab, he says. “But it is one thing for me to be willing to take a position as a post-doctoral fellow in an experimental lab, and yet another to be considered a viable candidate. The latter I owe to car repair.”

The Isaac Newton Medal includes a prize of £1000 and is the only one of the IOP’s awards that is open to an international field beyond the shores of the UK and Ireland. Corkum will give the Isaac Newton Lecture in London at a date to be confirmed and the IOP has published an interview with the winner.

The IOP has also announced the winners of 21 other awards today and you can find a full list here.

First human scanned with spectral X-ray scanner

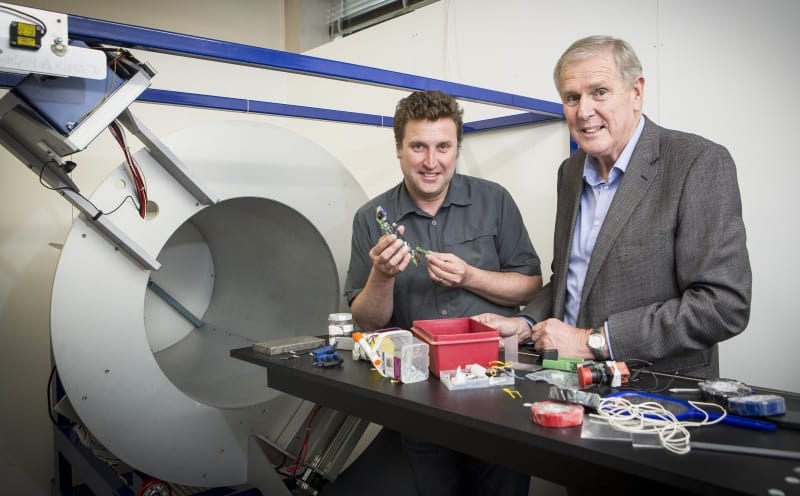
The first human has been scanned with a revolutionary 3D colour medical scanner developed by father and son scientists in New Zealand. Phil Butler, a physicist working at the University of Canterbury, and Anthony Butler, a radiologist at the Universities of Otago and Canterbury, invented the MARS spectral X-ray scanner, which has been commercialized by MARS Bioimaging.

The MARS scanner uses Medipix3 technology developed at CERN to produce multi-energy images with high spatial resolution and low noise. Medipix is a family of read-out chips originally developed for the Large Hadron Collider and modified for medical applications.

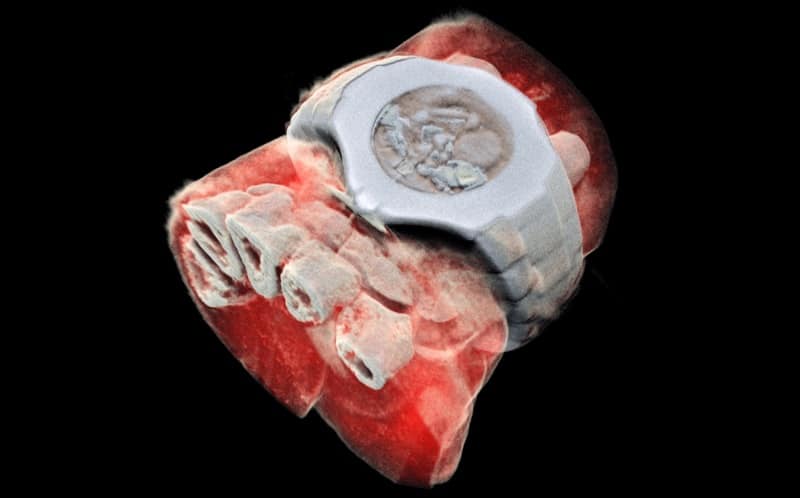
The Medipix3 detector measures the energy of each X-ray photon as it is detected. This spectral information is used to produce 3D images that show the individual constituents of the imaged tissue, providing significantly improved diagnostic information.

Phil Butler says that CERN’s Medipix3 technology sets the machine apart diagnostically because its small pixels and accurate energy resolution allow it to record images that no other imaging tool can. “As a new imaging device, a new microscope if you like, biomedical researchers can non-invasively see different kinds of detail inside patients,” he explains.

Small versions of the MARS spectral scanner that can house tissue samples are already in use in research institutions around the world. So far, researchers have used these scanners to study cancer, bone and joint health, and vascular diseases that cause heart attacks and strokes. “In all of these studies, promising early results suggest that when spectral imaging is routinely used in clinics it will enable more accurate diagnosis and personalization of treatment,” says Anthony Butler.

3D MARS scan

Phil Butler was the first person to be scanned with the MARS spectral scanner, using a larger version to image his ankle and wrist. The next step is an imminent clinical trial, where orthopaedic and rheumatology patients from Christchurch will be scanned. This will allow the MARS team to compare the images produced by their scanner with those generated by current technology used in New Zealand hospitals.

Anthony Butler says that after a decade in development, it is really exciting to have reached a point where it’s clear the technology could be used for routine patient care. “X-ray spectral information allows health professionals to measure the different components of body parts such as fat, water, calcium and disease markers. Traditional black-and-white X-rays only allow measurement of the density and shape of an object,” he says.


3D bioprinting simulations help optimize bioinks

3D bioprinting has the potential to revolutionize medicine because it will allow patient-specific human tissues to be fabricated in the lab. The technology relies on the availability good “bioinks” – biomaterials laden with cells that are used to print the biological structure – but evaluating the printability of individual inks in experiments is proving to be time-consuming, costly and complicated. Researchers are therefore turning to computer simulations as a complementary technique.

“As well as allowing us to evaluate the printability of a bioink, simulations could also help us choose the printing technique that should be employed depending on the target tissue,” explains Kajsa Markstedt, who is at the Wallenberg Wood Science Center (WWSC) in Gothenburg, Sweden. “Such techniques vary depending on the viscosity and nature of the ink being printed, and include ink-jet printing, laser-induced forward transfer, microvalve- and extrusion-based bioprinting.”

“This provides a better understanding of why certain printer settings and bioinks work better than others”

Kajsa Markstedt, Wallenberg Wood Science Center

Markstedt and colleagues worked with Johan Göhl’s team at the Fraunhofer Chalmers Centre to model the process using a computational fluid dynamics tool (Biofabrication 10 034105). “To model how a bioink is dispensed, we used its mass flow rate and density as input in our calculations,” says Markstedt. “These parameters are the ones most commonly evaluated in experiments when printing designs such as lines, grids or cylinders.”

Markstedt explains that the printability is usually determined with regards to the ratio of line width to nozzle diameter, the number of layers that can be printed before the structure collapses or the curvature of printed lines. “In our simulations, we also used the printing path of a grid structure as input.”

The Fraunhofer Chalmers Centre scientists also modelled the wettability of bioinks on a substrate using a dynamic contact-angle model that depends on surface tension and an apparent contact angle as input. Their full rheology model was based on ink-oscillation frequency data obtained in experiments, and the viscoelastic behaviour of the material.

Model mirrors reality

Simulations on cellulose nanofibril (CNF) inks produced very similar outcomes to experimental results obtained in laboratory evaluations, even for bioinks with very different rheological properties. What’s more, the computer model enabled the researchers to follow the printing process in real time, and study the behaviour of different inks while they are being dispensed.

“In experimental evaluations, we often only have the properties of the final, printed grid structure to go on,” explains Markstedt. “This is a time-consuming way to develop new bioinks or to optimize printing parameters for a specific ink. It is also expensive since the prepared bioink containing cells is precious.”

The biostructure also needs to be tested shortly after being printed – while the cells are still viable – which limits the time for extensive evaluations. “This often leads to many bioinks being printed at printing parameters that have not been optimized for a specific bioink composition,” continues Markstedt. “The result is that the right architecture is not produced, which can be catastrophic because the printed tissue does not function properly. For example, the printed line may be too thin causing the structure to break, or too thick, which prevents nutrients and oxygen reaching all the cells in the bioink.”

The teams is confident that the new simulation tool overcomes all these problems, while also providing much more feedback during the printing process itself, such as how viscoelastic- and shear stresses are distributed in the ink. “This provides a better understanding of why certain printer settings and bioinks work better than others,” says Markstedt. “For example, it allows us to isolate individual parameters, such as printing speed, printer nozzle height, ink flow rate and printing path to study how they influence printing.”

Looking forward, the researchers are now planning to expand their studies to model the flow of ink inside pre-defined nozzle geometries. “This addition to the model will allow us to observe what effect shear stresses from the nozzle have on the printing process,” says Göhl. “This will help us to determine how different printing pressures and nozzle shapes affect the bioprintability of a bioink.”

  • Read our special collection “Frontiers in biofabrication” to learn more about the latest advances in tissue engineering. This article is one of a series of reports highlighting high-impact research published in Biofabrication.

Fusion dreams

I recently attended a two-day event at the Royal Society in London on using tokamaks as a fusion-energy source. People have, of course, been working on fusion for years – even TV pioneer Philo Farnsworth, whom I mentioned in last month’s column, developed a prototype reactor, called the “fusor”, back in the 1960s. But why has fusion proved so hard to harness here on Earth? As people often like to ask, why is fusion always 30 years away?

Why has fusion proved so hard to harness here on Earth? As people often like to ask, why is fusion always 30 years away?

You only need to look up to the Sun for proof that fusion works. Achieving it here on Earth is just an engineering problem, right? Simply fuse two nuclei together to make a bigger atom, which releases four times as much energy as fission. A lot of smart people are working on fusion and a lot of money has been spent. So why don’t we have clean, cheap fusion power right now?

The problem, as I quickly realized from the Royal Society meeting, is getting the nuclei close enough for long enough for fusion to occur. That will happen only if you can exceed a figure of merit known as the “triple product” of heat, confinement density and time. Some amazing approaches have been adopted to solve this problem including huge superconducting magnets, massive pulsed lasers, fused ion beams and mechanical rams.

Many have achieved fusion, but that’s not enough. What you want is to generate more energy than is used to start the reaction. No-one has yet reached “breakeven”, but when we do, we’re on the road to generating power. Most of the world’s effort is on doughnut-shaped reactors called tokamaks, which usually employ the tritium reaction – heavy hydrogen – to produce helium, energy and fast-moving neutrons.

The Royal Society event showcased a bewildering list of engineering and physics challenges, including achieving temperatures of way above 5×10⁷ K in a low-vacuum plasma and confining it using high-performance superconductors to generate a fusion reaction. This, in turn, involves cooling superconducting magnets to below 30 K even though they’re barely 300 mm from the hot plasma.

What you build is important because materials hit by high-energy neutrons released by the fusion reaction change over time. Nickel in stainless steel, for example, transforms into cobalt-60. So how should you shield the reactor walls from these neutrons? And how do you perform maintenance on the reactor, given that it has now become highly radioactive? The challenges are immense. But so are the rewards.

Smaller is better

The quest for fusion reminded me of the time I worked for an optical company in the 1990s when the race was on to deliver lower-cost integrated optics components. I was involved in other products but also sat in on engineering meetings attended by a much bigger group of colleagues, who had to fulfil a huge, multi-million dollar order for lots of telecoms components.

The customer had been given a spec sheet and some PowerPoint roadmap slides, but after many iterations, which involved working on several tricky problems in parallel over the course of a year or so, little progress had been made. Improving the design in one area simply made things worse in another and they still didn’t have a prototype that was up to spec – let alone a manufacturable product.

I envisaged a different approach. No-one in the team wanted to hear it but – undeterred – I spoke to the company’s chief executive, who asked me how long my idea would take. When I replied “six weeks or so”, the next thing I knew, I was running a team to put my idea into practice. My tactic was to focus on the specification and the application, not the utopian PowerPoint picture. So I hopped on a plane and presented a mock-up of the new product to the customer, who said it was exactly what they wanted. The team delivered a prototype just three weeks after that – and the customer liked it too.

Our company’s philosophy thereafter was to develop the “minimal viable product” and do so faster. It proved successful for the firm. All I did was change the number of problems we tackled at once. What we built wasn’t perhaps as small or as cool as the original PowerPoint vision, but it worked.

Business brains

So what has this got to do with fusion? Well, the current global fusion effort is the $18bn ITER experimental reactor being built in France. It’s a multinational, “big-science” affair, involving China, the EU, India, Japan, Russian, South Korea and the US. The latest plan is for ITER to come on line in 2025 and that, by 2035, it should point the way to a commercial fusion reactor (DEMO), which would then be built and connected to the electricity grid by 2060.

But to build enough of these reactors to get past 10% of global demand could take until the end of the century. This strikes me as a little too late. I see more hope from the business sector. Firms such as Tokamak Energy, TAE Technologies, General Fusion, Lockheed Martin and Commonwealth Fusion Systems seem to be iterating on shorter timescales to home in on economically viable, smaller reactors. Tokamak Energy, for example, believes it will have production reactors by 2030 by iterating designs on timescales of a few years.

So who will get there first: the commercial hares or the big-science tortoises? I know which my money is on.

Renewables growing fast, but not fast enough

The headline figure in REN21’s 2018 review of the global status of renewable energy is that, in 2017, renewables supplied 26.5% of global electricity, which coincidentally was about the same as for the UK. The UK has now moved up to around 30% and that may well be true globally too. Certainly, REN 21 says that renewables’ share of final energy consumption has continued to grow globally, at around 5.4% averaged over the last 10 years for modern renewables, more for some technologies. By contrast, over that period, fossil and nuclear only grew by 1.6% and energy demand by 1.7%.

REN 21 reports that 178 GW of renewable power generation capacity was added in 2017. That was 70% of net additions to global power generating capacity in 2017, the largest percentage so far, bringing the global total to 2195 GW, with non-hydro renewable capacity (in all 1081 GW) likely to overtake hydro capacity (1114 GW) in 2018. Of the new capacity added in 2017, 159 GW was non-hydro renewables and 19 GW hydro. Overall, with hydro included, renewables accounted for 26.5% of total global electricity generation in 2017, up from 24.5% a year earlier, with hydro at 16.4%, wind 5.6%, bio-power 2.2%, solar PV 1.9%, and 0.4% for ocean power, concentrated solar, and geothermal combined.

 In 2017, 52 GW of wind capacity was added, bringing the global total to 539 GW. But that was lower growth than in the previous year, due mainly to a slowdown in China, in part a result of problems with curtailment – about 42 TWh of wind energy was curtailed in China last year. Even so, at 19.7 GW, China was still the leader in new installations. Of the total global installed wind power, 18.8 GW was offshore, with nine countries adding 4.3 GW in 2017, led by the UK (1.7 GW), Germany (1.2 GW) and China (1.2 GW).

Solar photovoltaics (PV) have continued to expand rapidly, installing more capacity than any other power generating technology, and rising by 98 GW, about 33%, in 2017. That has increased the global total to about 402 MW. China led, with PV installations growing more than 50%.

However, while progress was good for electricity, REN 21 says “the power sector on its own will not deliver the emissions reductions demanded by the Paris climate agreement…to ensure access to affordable, reliable, sustainable and modern energy for all. The heating and cooling and transport sectors, which together account for about 80% of global total final energy demand, are lagging behind”.

That point is reinforced by REN21’s new adjusted figures for the total global renewable energy contribution, including biomass, which has only grown by 2.3% over the last decade, mainly since the use of traditional biomass, e.g. in China, has fallen, cutting global biomass’ growth rate to 0.2%. The result of that, and other changes, is that the estimated total global renewables share of final energy consumption was only around 18.2% in 2016, down from the 19.3% estimate in the 2017 REN21 review, with modern renewables now at 10.4%.

Seeking to improve that, REN21 looks at system integration, and better end-use efficiency, e.g. in heating and transport. Rana Adib, executive secretary of REN21 said: “We may be racing down the pathway towards a 100% renewable electricity future, but when it comes to heating, cooling and transport, we are coasting along as if we had all the time in the world. Sadly, we don’t.” REN21 said of particular concern was that global energy demand and energy-related carbon dioxide emissions rose for the first time in four years in 2017, by 2.1% and 1.4% respectively.

The International Energy Association’s Tracking Clean Energy Progress review came up with a similar message, but reflecting the IEA’s wider set of technology commitments, including nuclear and fossil carbon capture and storage (CCS). While there was some good progress, energy efficiency improvements had slowed and progress on CCS had stalled. Progress in deploying onshore wind and energy storage had also slowed. Nuclear was also unlikely to meet the level envisaged in the IEA’s 2025 Sustainable Development Scenario. Overall, Fatih Birol, IEA head, said: “there is a critical need for more vigorous action by governments, industry, and other stakeholders to drive advances in energy technologies that reduce greenhouse gas emissions. The world doesn’t have an energy problem but an emissions problem, and this is where we should focus our efforts”.

However, there have also been some more positive reports, mapping out a different, more optimistic view, with energy efficiency seen as key. Indeed, in its Energy Transition Outlook, the DNV-GL global consultancy company claims that efficiency will dominate so demand will fall. It says the energy intensity of the global economy, i.e. the energy used per unit of economic output, will improve more quickly than the rate of global economic growth in the next three decades. As a result, global energy demand will flatten for the first time in our post-industrial history.

This view is also central to a new academic study. Published in Nature Energy, the study claims that it is possible to reduce global energy demand so that by 2050 it falls to 245 EJ, around 40% lower than today, despite rises in population, income and economic activity. Using an “integrated assessment modelling” framework, it shows how changes in the quantity and type of energy services, affecting demand patterns, drive structural change in intermediate and upstream supply sectors. Overall it says that “down-sizing the global energy system dramatically improves the feasibility of a low-carbon supply-side transformation”. Its Low Energy Demand (LED) scenario meets the Paris 1.5 °C climate target as well as many sustainable development goals, without relying on negative emission techs.

One of the keys is seen to be smart digital IT-based energy systems. “The integration of multiple service functions in single devices (particularly smartphones) yields up to a 100-fold potential power saving while in use. Devices increasingly become ‘smart’ & interconnected, which opens up potential for controllability, system integration (including load management) and demand response.” That also helps with mobility services and transport while, overall, “energy intensity improves drastically due to the combined effects of electric vehicles and new organizational models of service provision, which include shared mobility”.

Energy and resource-use efficiency is upgraded in all sectors, cutting demand: “Industrial-process energy efficiency improves by one-fifth. The aggregate total material output decreases by close to 20% from today, one-third due to dematerialization, and two-thirds due to improvements in material efficiency. ‘Dematerialization’ describes a lower absolute material use due to increases in asset utilization, for example, shared-car fleets that require fewer cars. ‘Material efficiency’ includes light-weighting, for example, less material input per car”.

Changes in energy end-use drive a supply-side transformation, with “strong electrification of energy end-use, consistent with the narrative of pervasive digitalization and more versatile end-use technologies that are also non-polluting at the point of use. Over the longer term, hydrogen also increases its share of the final energy demand (in addition to its role for energy storage)”. Consistent with the LED scenario narrative, “granular energy-supply technologies, such as heat pumps, fuel cells and solar photovoltaics proliferate. Granularity, decentralization and variable renewables pose significant challenges for system management and balancing, addressed via ‘smart’ transformation of physical networks and control systems and scaled-up storage and load-management options”.

The study team admits that a massive effort would have to be made to bring all this to reality: there would have to be “rapid innovation, cost reductions and performance improvements from the widespread diffusion of granular end-use and low-carbon supply technologies”, that would require “sustained innovation policies aligned to credible efforts to stimulate market demand”, while regulators “need to ensure that space is opened up for new business models, digital integration and distributed service provision to overcome incumbents’ vested interests to slow structural change”. But it claims it is technically viable. If so, that’s a huge game changer, allowing renewables to deliver all that’s needed, and cutting emissions fast. Too good to be true? It certainly looks impressive, if a little fantastic. A vast series of technical fixes. See Carbon Brief’s review of the paper.

 But for very different views, see some of the oil company scenarios in my next post.

How do rivers alter sea-level?

For the first time, researchers have accounted for river outflow in models of sea-level rise in coastal areas.

“The equation we derived lets us predict how much sea level will rise based on river flow, and then compare that prediction to actual measurements and observations,” says Chris Piecuch of Woods Hole Oceanographic Institution (WHOI). “Based on our model and the observations, we’re finding that variations in the amount of water that comes out of a river annually can raise or lower coastal mean sea level by several centimetres.”

Piecuch and colleagues combined decades’ worth of river level and tidal data from gauges throughout the eastern US with information on water density, salinity and the Earth’s rotation. The result was a model describing the link between river discharge and sea level on an annual basis.

The team found that most of the sea-level change caused by a river occurs on one side of its mouth. Freshwater is less dense than saltwater so river outflow floats on the ocean’s surface; the Earth’s rotation forces it to turn sharply along the coast. In the northern hemisphere the water follows the right-hand side of the river, pushing water up against the shoreline and raising local sea levels. In the southern hemisphere the water follows the left-hand side of the river.

Satellite measurements don’t have enough resolution to provide accurate readings of ocean height within a few miles of the coast so the model, currently a proof-of-concept, could ultimately help calculate the effects of sea-level rise on certain coastlines.

“When you think of societal impact, you want to know what’s happening at the coast,” says Piecuch. “In low-lying areas like Bangladesh, we don’t yet know how sea level and river outflow combine. But if a major storm comes through, even a small rise in the background mean sea level could have a huge impact on flooding.”

Piecuch and colleagues, who reported their results in PNAS, aim to extend the work to understand how individual events like a hurricane or massive rainfall affect ocean levels.

“Many processes can affect sea level, making predictions of regional sea level change a challenging endeavour,” says Larry Peterson of the US National Science Foundation. “These scientists show that discharge from rivers can play a significant but overlooked role in the interpretation of sea level from downstream tide gauges. The work has important implications for climate models, remote sensing, and the projection of coastal flood risks.”

Simulations improve MEG spatial resolution

Researchers at the University of Nottingham have demonstrated an optimized method to analyse magnetoencephalography (MEG) data that can improve spatial resolution to the order of 3-5 mm. They achieved this with the aid of an optimized algorithm and custom 3D-printed foam headcasts that restricted participant head movement to about 1 mm. First shown in simulation, then validated in participants who performed a finger movement task, this improved accuracy enabled better measurement of spatial organization of human brain electrophysiology, non-invasively (NeuroImage 10.1016/j.neuroimage.2018.06.041).

What is MEG?

MEG measures the magnetic fields generated by neural current flow in the brain with high (millisecond) temporal resolution, allowing measurement of very fast time-frequency dynamics of brain networks. This is unlike brain imaging techniques such as functional MRI (fMRI), which rely on a lagged, indirect blood oxygenation measure of neural activity, making it difficult to capture fast events.

Spatial mapping of electrical sources using MEG is, however, complicated since there are many more voxels in the brain than there are magnetic field sensors in the scanner. This makes the inverse problem (inferring source distributions based on extracranial fields) non-unique, and hence requires the use of complicated localization algorithms, such as beamforming. Blurring of the measured fields due to having fewer sensors than current sources is exacerbated by participant movement. In this work, the researchers minimized blurring due to the inverse problem by optimization of the beamforming algorithm, while head movement was mitigated using the foam headcasts.

In the healthy brain, movement (of a finger, for example) causes measurable changes in brain waves, with a decrease of beta waves (13-30 Hz) during movement, followed by an increase above baseline after movement cessation. The latter effect, the so-called rebound, is thought to be a marker of neural inhibition and is spatially specific.

Simulation studies

In simulations, the researchers modelled two point sources with time courses that were alternately on and off in response to theoretical stimulation. By segmenting the MEG data into two datasets and calculating separate beamformer weights (for spatial localization), rather than beamforming the whole dataset, the spatial separation of the sources was improved significantly.

In other words, removing sources of no interest left fewer sources to be minimized by the beamformer equation, leading to a sharper localized peak. However, the team suggest that there should be sufficient data to allow this segmentation; for a detectable signal, many MEG trials must be acquired.

For the experiments, participants performed multiple runs in the MEG scanner while tapping either their index (D2) or little (D5) finger, with rests in between each tap. A similar task was performed using fMRI, for comparison.

Since the same participants underwent fMRI and MEG, the maps of digit representations in the brain from the two neuroimaging modalities could be overlaid on the same anatomical image. The researchers could then calculate distances between MEG D2 or D5 and fMRI D2 or D5 in the same space.

Digit distances

The researchers found that the representations of the index (D2) and little (D5) finger in the cortex of individual subjects could be separated spatially using MEG, even when separation distances were only about 3-5mm. The beta rebound was shown to be mapped topographically in accordance with well characterized topography of the sensorimotor cortex. Furthermore, they showed significant overlap between MEG and fMRI.

However, the overlap between blood oxygenation level dependent (BOLD) fMRI and MEG responses were not perfect – the distances between D2 and D5 in each modality were different, with fMRI giving larger distances. This may be due to assumptions in the MEG models used to derive sources. Alternatively, the differences may be neurophysiological in origin: the BOLD activity may be more spread out, encompassing somatosensory (touch) and motor regions, whereas the beta rebound may be more specific.

The authors

The authors note that the construction of custom headcasts is expensive, and that this should be taken into account for large cohort studies – although the benefits to data quality may outweigh the costs.

This research showed that MEG has the required spatial resolution to delineate separate digit responses in the same hand, using the beta rebound; first in simulation and then validated experimentally. MEG therefore has an untapped potential in spatial resolution, which could be exploited in patient cohorts with possible sensorimotor alterations, for example focal hand dystonia (writer’s cramp).

Did dark matter have a chilling effect on the early universe?

New research lends further support to the idea that a detection of surprisingly strong absorption by primordial hydrogen gas, reported earlier this year, could be evidence of dark matter. The new results, described in three papers in Physical Review Letters, are theoretical and do not settle the issue. Indeed, one group is sceptical of the dark-matter interpretation. But the work heightens interest in ongoing observations of the “cosmic dawn”, with new results from radio telescopes expected within the next year.

According to cosmologists, the hydrogen gas that existed in the very early universe was in thermal equilibrium with the cosmic microwave background (CMB), which meant that the gas would not have been visible either through absorption of the microwave photons or through emission. But at the start of the cosmic dawn about 100 million years after the Big Bang, ultraviolet light from the first stars would have excited the hydrogen atoms and shifted the distribution of electrons within the lower and upper levels of the hyperfine transition. As such, the hydrogen would have started to absorb much more radiation at the transition wavelength (21 cm), which would be seen today as a dip at longer, re-shifted wavelengths in the CMB spectrum.

The stakes are high because if the signal is real, this experiment is worth two Nobel prizes

Abraham Loeb

In February, researchers working on the Experiment to Detect the Global Epoch of Reionization Signature (EDGES) telescope reported in Nature that they had seen just such a dip at a wavelength of 380 cm in data from their small ground-based antenna system in Western Australia. The observation was exciting news, but nevertheless in line with standard cosmological theory. However, the dip was actually twice as deep as expected – immediately leading theorists to speculate that the hydrogen was in fact interacting with particles of dark matter.

“The stakes are high because if the signal is real, this experiment is worth two Nobel prizes,” says Abraham Loeb of Harvard University. “One for being first to detect the 21 cm signal from the cosmic dawn and the second for finding an unexpected level of hydrogen absorption that may be indicative of new physics.”

New or old force?

The idea is that the dark matter would have been colder than the hydrogen atoms and so interactions between the two would have transferred energy from the gas to the dark matter – so cooling the gas and boosting absorption. The possibility of this mechanism being tied to the switching on of the first stars was proposed by Rennan Barkana of Tel Aviv University in Israel, but Barkana suggested that the interaction could involve a new fundamental force between dark and ordinary matter.

However, Loeb and Harvard colleague Julián Muñoz argued that there could be no such force as it would have led to stars cooling more quickly than is observed. Instead, they reckon that the interaction could be that of familiar electromagnetism – requiring that a small fraction of dark matter particles have little mass and carry about a millionth of the charge of the electron.

That view has now won cautious backing from other researchers in the US. By imposing constraints from a wider range of cosmological and astrophysical observations, Asher Berlin of the SLAC National Accelerator Laboratory in California and colleagues have shown in a new paper that dark matter interactions could indeed explain the EDGES results if up to 2% of dark matter weighs in at less than a tenth the mass of the proton and has a charge less than 0.01% of the electron’s. Berlin and colleagues do, however, add that this scenario would require “additional forces” to subsequently deplete the dark matter so its abundance is in line with observations of the present universe. “Although it’s possible that dark matter could produce the EDGES result, it is not easy or simple to do so,” says Berlin’s colleague Dan Hooper of Fermilab near Chicago.

Extraordinary claims

Loeb acknowledges that “extraordinary claims require extraordinary evidence,” adding that the apparent 21 cm signal from EDGES could be nothing more than instrumental noise or absorption by dust grains in our galaxy. He looks forward to new results from other experiments operating at different sites – including SARAS-2, LEDA, and PRIzM – and expects new data to be available within the next year.

Even if the signal is confirmed, however, dark matter is not necessarily the culprit. Guido D’Amico and colleagues at CERN in Geneva argue in the second new paper that proponents of the dark-matter interpretation have carried out an “incomplete analysis” by neglecting the heating effect of dark-matter annihilation. In particular, they say that annihilations could inject electrons and low-energy photons into the hydrogen gas, thereby potentially heating the gas more than it is cooled. As such, they conclude, dark-matter annihilations are “strongly constrained” by a 21 cm signal.

In a third new paper, on the other hand, Anastasia Fialkov of the Harvard-Smithsonian Center for Astrophysics in the US and colleagues (including Barkana) show that the dark-matter hypothesis yields an additional prediction that can be tested using different kinds of radio telescope. They have found that the 21 cm signal should vary across the sky by up to 30 times as much as it would do if there were no charged interactions between ordinary and dark matter – and pointing out that this prediction can be tested using low-frequency interferometers.

Muñoz is enthusiastic about these spatial measurements, explaining that they are far more immune to foreground noise and other potential systematic errors than the data collected by EDGES, and are therefore, he says, “more reliable”. He reckons that a couple of interferometers – LOFAR in the Netherlands and HERA in South Africa – might have gathered sufficient data within the next five to ten years to establish definitively whether or not the dip at 21 cm really is due to charged dark matter.

Scott Pruitt resigns as head of the US Environmental Protection Agency

Scott Pruitt

Scott Pruitt has resigned as head of the US Environmental Protection Agency (EPA), just 17 months after taking up the position. US president Donald Trump has announced that Andrew Wheeler – a former lobbyist for the coal industry – will become acting administrator until a new EPA administrator is found. “I have no doubt that [Wheeler] will continue with our great and lasting EPA agenda,” Trump said announcing Wheeler’s promotion.

Pruitt’s time at the EPA has been controversial (see box). When Pruitt was attorney general of Oklahoma from 2011 to 2017 he sued the EPA 14 times. His nomination to lead the EPA in late 2016 even led to the US Environmental Defense Fund to announce its opposition – the first such action in the fund’s 50-year history. Those concerns did not recede during his time in office. Some his decisions, wrote Christine Todd Whitman, EPA administrator under President George W. Bush, presented “real and lasting threats to the nation’s land, air, water, and public health”.

In his resignation letter to Trump, Pruitt cited “unrelenting attacks on me personally, my family” as his reason for stepping down. Yet Pruitt has come under increasing pressure for a number of months following questions about his spending and housing arrangements. In accepting his resignation, Trump noted that Pruitt had done an “outstanding job”.

Trump then quickly announced that Wheeler would become acting administrator. In April, Wheeler was confirmed by the US Senate as Pruitt’s assistant administrator and he has previously served in the EPA’s Office of Pollution Prevention and in the office of Oklahoma Senator James Inhofe. Yet while Wheeler brings more Washington experience than Pruitt, he is also a strong denier of anthropogenic climate change. “We are definitely concerned that he will continue Scott Pruitt’s record of hostility to environmental protections,” says Benjamin Longstreth, a lawyer at the Natural Resources Defense Council.

Analysis: Scott Pruitt leaves a cloudy legacy

When he resigned from his position as administrator of the Environmental Protection Agency (EPA) last week, Scott Pruitt left a cloudy political legacy. Despite the scandals that led to his departure, he had worked hard to fulfill the Trump administration’s platform of reducing environmental regulations to encourage industrial growth. But many of his efforts have had little permanency, making them vulnerable to reversal by any succeeding administration. And others were drafted so poorly that they were almost immediately tied up in legal challenges.

Pruitt had some successes in achieving the Republican party’s environmental policy goals. He played a key role in persuading US president Donald Trump to pull out of the Paris agreement on climate change. He sidelined government scientists inside the EPA and outside academic advisers from policy-making meetings in favour of industry representatives.

Changing government regulations is a complex and time-consuming process that can face frequent legal roadblocks. In several cases, such as the proposal to relieve car companies of the need to improve their fleets’ fuel efficiency, Pruitt issued only initial proposals, without the legal details. Indeed, courts have already overturned at least half a dozen efforts to pull back regulations produced by President Barack Obama’s EPA, on such issues as controlling lead paint and pesticides.

While environmentalists have expressed joy at Pruitt’s departure, such celebrations may be short-lived depending on who succeeds him.

Copyright © 2026 by IOP Publishing Ltd and individual contributors