World’s great cities hold key to fossil fuel cuts

Governments anxious to reduce the national use of fossil fuels and limit climate change now know where to start: in the great cities. New research has confirmed what with benefit of hindsight should have been obvious – that the 54% of humanity that lives in the cities now accounts for more than 70% of global energy use.

And a new study of the so-called “carbon footprint” of 13,000 of the world’s urban areas has identified the most effective places to start. “The top 100 highest footprint cities worldwide drive roughly 20% of the global carbon footprint,” says Daniel Moran, of the Norwegian University of Science and Technology.

“This means concerted action by a small number of local mayors and governments can significantly reduce national carbon footprints.”

Matching information

Moran and colleagues from Japan, the US and Sweden report in the journal Environmental Research Letters that they defined cities as densely populated, contiguously built up urban areas, often straddling administrative boundaries. From space, Manchester and Salford in the UK would look like one city; Manhattan and Brooklyn, in the US, or Tokyo and Yokohama in Japan, would fade into each other.

The researchers then matched all the information they could find about existing carbon footprints – estimates of energy consumption – with national statistics on spending patterns, regional purchasing power data and a population map.

Cities – historic concentrations of people, business, industry, government, legislation, learning and inventiveness – are also concentrations of economic growth: 600 urban centres are thought to account for about 60% of global gross domestic product.

Cities may drive climate change, but they are also concentrations of people who will be most at risk, not just because cities are hotter than the surrounding countryside, but because, as the world warms, more people in more cities become increasingly vulnerable to extremes of heat and flood.

The message of the study is simple: when it comes to reducing fossil fuel use, carbon footprint and emissions of greenhouse gas, mayors, governors, councils and city bosses have as much opportunity as national governments – and more direct influence.

The scientists assembled their list of 13,000 cities from data from 187 of the world’s nations. Altogether 195 nations in 2015 in Paris agreed to work together to contain global warming, driven by fossil fuel use and consequential increases in atmospheric carbon dioxide, to, if possible, no more than 1.5 °C above historic levels by 2100.

In fact, the world has already warmed by around 1 °C on average in the last century: the challenge is to act in time to stop global warming rising to catastrophic levels.

Several surprises

And the new study delivers some useful places to begin. The top 100 cities are home to only 11% of the world’s population but drive 18% of the global carbon footprint.

The top three – Seoul in Korea, Guangzhou in China and New York in the US – are no surprise, but other metropolitan areas with unexpectedly large carbon footprints include Cologne in Germany, Manchester in the UK and Montreal in Canada.

Of the top 200, 41 cities – and these include Cairo in Egypt, Dhaka in Bangladesh and Lima in Peru – are in countries where both total emissions and emissions per head are low. But many of the world’s most carbon-intensive cities are in the world’s richest nations: that is, their civic authorities have the resources with which to act.

“The fact that carbon footprints are highly concentrated in affluent cities means that targeted measures in a few places and by selected coalitions can have a large effect covering important consumption hotspots,” says Moran.

Sterile neutrinos, climate change and smart cities

In this episode of Physics World Weekly, we look first at the results from Fermilab, which provide evidence for a new type of particle known as a sterile neutrino. Researchers at the Mini Booster Neutrino Experiment (MiniBooNE) say their findings offer a tantalizing glimpse of physics beyond the Standard Model of particle physics. But not everybody agrees.

Later in the programme, Liz Kalaugher speaks about international agreements on curbing fossil fuel emissions and the likelihood of meeting them. She explains why there has been a recent flurry of research papers on the impacts of 1.5 °C warming compared with 2 °C.

Finally, James Dacey explains the concept of “smart cities” – what it means and why we need them. He discusses a recent interview he had with sustainability researcher Bauke de Vries of TU Eindhoven in the Netherlands. De Vries is involved in the Brainport Smart District, a smart city test site being developed near the Dutch city of Helmond.

If you enjoy what you hear, then you can also subscribe to our monthly podcast, Physics World Stories, which you will find on iTunes and other podcast directories.

Muon antineutrino oscillation spotted by NOvA

The best evidence yet that muon antineutrinos can change into electron antineutrinos has been found by the NOvA experiment in the US. The measurement involved sending a beam of muon antineutrinos more than 800 km through the Earth from Fermilab near Chicago to a detector in northern Minnesota. After running for about 14 months, NOvA found that at least 13 of the muon antineutrinos had changed type, or “flavour”, during their journey.

The results were presented at the Neutrino 2018 conference, which is being held in Heidelberg, Germany, this week. Although the measurement is still below the threshold required to claim a “discovery”, the result means that fundamental properties of neutrinos and antineutrinos can be compared in detail. This could shed light on important mysteries of physics, such as why there is very little antimatter in the universe.

Neutrinos and antineutrinos come in three flavours: electron, muon and tau. The subatomic particles also exist in three mass states, which means that neutrinos (and antineutrinos) will continuously change flavour (or oscillate). Neutrino oscillation came as a surprise to physicists, who had originally thought that neutrinos have no mass. Indeed, the origins of neutrino mass are not well-understood and a better understanding of neutrino oscillation could point to new physics beyond the Standard Model.

Pion focusing

NOvA has been running for more than three years and comprises two detectors – one located at Fermilab and the other in Minnesota near the border with Canada. The muon antineutrinos in the beam are produced at Fermilab’s NuMI facility by firing a beam of protons at a carbon target. This produces pions, which then decay to produce either muon neutrinos or muon antineutrinos – depending upon the charge of the pion. By focusing pions of one charge into a beam, researchers can create a beam of either neutrinos or antineutrinos.

The beam is aimed on a slight downward trajectory so it can travel through the Earth to the detector in Minnesota, which weighs in at 14,000 ton. Electron neutrinos and antineutrinos are detected when they very occasionally collide with an atom in a liquid scintillator, which produces a tiny flash of light. This light is converted into electrical signals by photomultipler tubes and the type of neutrino (or antineutrino) can be worked-out by studying the pattern of signal produced.

The experiment’s first run with antineutrino began in February 2017 and ended in April 2018. The first results were presented this week in Heidelberg by collaboration member Mayly Sanchez of Iowa State University, who reported that a total of 18 electron antineutrinos had been seen by the Minnesota detector. If muon antineutrinos did not oscillate to electron antineutrinos, then only five detections should have been made.

“Strong evidence”

“The result is above 4σ level, which is strong evidence for electron antineutrino appearance,” Sanchez told Physics World, adding that this is the first time that the appearance of electron antineutrinos has been seen in a beam of muon antineutrinos. While this is below the 5σ level normally accepted as a discovery in particle physics, it is much stronger evidence than found by physicists working on the T2K detector in Japan – which last year reported seeing hints of the oscillation.

In 2014-2017 NOvA detected 58 electron neutrinos that have appeared in a muon neutrino beam. This has allowed NOvA physicists to compare the rates at which muon neutrinos and antineutrinos oscillate to their respective electron counterparts. According to Sanchez, the team has seen a small discrepancy that has a statistical significance of just 1.8σ. While this difference is well within the expected measurement uncertainty, if it persists as more data are collected it could point towards new physics.

Sanchez says that NOvA is still running in antineutrino mode and the amount of data taken will double by 2019.

Phase-contrast CT reveals impact of microbeam radiotherapy

PCI-CT

Neuro-radiosurgery is evolving to become more effective and less destructive to healthy brain tissue. One emerging approach is X-ray microbeam radiotherapy (MRT), a spatially fractionated radiation delivery method being investigated for the treatment of malignant brain tumours. MRT irradiates tissue with a synchrotron beam reshaped into arrays of highly collimated, micrometre-thick microbeams. The approach administers spatially-restricted peak doses of up to hundreds of gray to both healthy and tumour tissues

To study the effects of MRT, a European research team has used X-ray phase contrast CT (PCI-CT) – an experimental high-resolution imaging technique – to perform ex vivo studies of normal and cancerous rat brain morphology after treatment at the European Synchrotron.

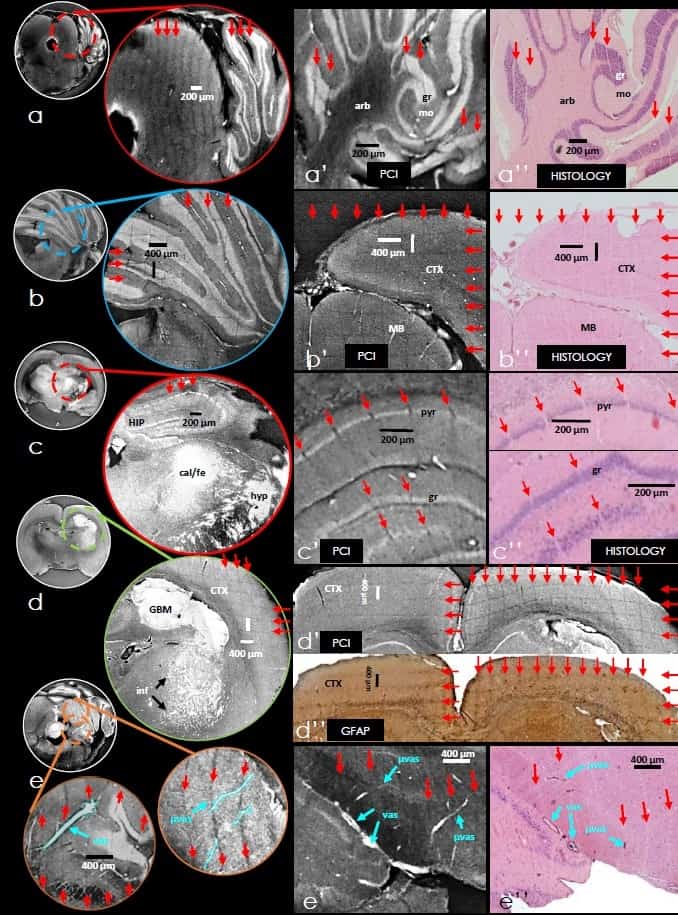
The researchers found that PCI-CT could detect the effects of MRT throughout target tissue areas and distinguish cancerous tissue morphology, necrosis, and intra-tumour accumulation of calcium and iron deposits. It visualized brain anatomy and micro-vasculature in 3D. Importantly, PCI-CT displayed high soft-tissue contrast without requiring a contrast agent, enabling effective 3D segmentation and renderings of complex brain structure (Int. J. Radiat. Oncol. Biol. Phys. 10.10.1016/j.jirobp.2018.03.063).

High-resolution insight

For the study, Giacomo Barbone from Ludwig Maximilians-Universität München and co-authors implanted glioblastoma cells in the brains of six rats. They treated these rodents plus three healthy controls with a variety of different MRT protocols.

Following MRT, the rats were sacrificed 45 days later, and their brains were extracted for imaging. The researchers then acquired PCI-CT image datasets with 3000 projections over 360° in half acquisition, giving an overall horizontal field-of-view of 30 mm. They reconstructed images using standard filtered back-projection algorithms and computed brain vessel 2D maximum intensity projection (MIP) maps. To obtain a comparable MRI dataset to validate PCI, the authors imaged one cancerous brain sample with a pre-clinical 9.4T MR scanner.

The authors reported that the full structure of a healthy brain (including cerebellar, cortical, thalamic, and hypothalamic structures) was well visualized in both sagittal and coronal slices. Brain sub-region anatomy could be visualized in the coronal slices.

They observed cancerous brain tissue within striatum, thalamic and hypothalamic regions, as well as inside lateral vessels. These were visible as regions of higher phase-contrast relative to normal brain parenchyma. The PCI signal within glioblastoma tissue was generally higher than in normal nervous tissue. Necrotic areas in the centre of tumour masses generated low PCI signal. Calcium and iron accumulation within degenerating cancerous tissues created intense bright signals in PCI.

The researchers identified brain blood vessels in normal and tumour-bearing tissues throughout the PCI data. They were able to segment hyper-dense features to create 3D vessel-network trees, and create 2D MIP maps by superimposing several consecutive image slices. Larger superficial blood vessels in the subarachnoid space were visualized as bright tubes, and intra-cortical vasculature and capillaries as bright tubules. Deep hyper-dense microvascularization had the visual appearance of either an organized network or a “chaotic bundle” wrapping around the glioblastoma in a tumour-bearing cerebrum.

Tissue effects caused by MRT were also well visualized. Brain tissue was marked with 50 μm parallel lines of ablation from the spatially-fractionated microbeams, and hypo-dense comb-like patterns were seen. PCI clearly showed the morphology of MRT-targeted local vasculature and microvasculature, as well as intra-cortical microvasculature, cancerous lesions, MRT-driven tissue ablations and minute cerebral structures.

One potential benefit of PCI is that it does not require extensive sample preparation. The sample does not need dissection, making it well-suited for some post-mortem morphological brain analyses. In addition, PCI concurrently visualizes tumour tissues, healthy tissues, micrometric angio-structure, and the effects of high-dose ionizing radiation in a “one-shot” image.

The researchers believe that PCI could be employed to precede and guide histological analysis. Because PCI can quantify tissue volume modifications, the technique could potentially also be used for studies of brain tumour tissue radio-resistance or to assess drug efficacy in experimental models of neurodegeneration.

Has fishing given cod a ‘depth sentence’?

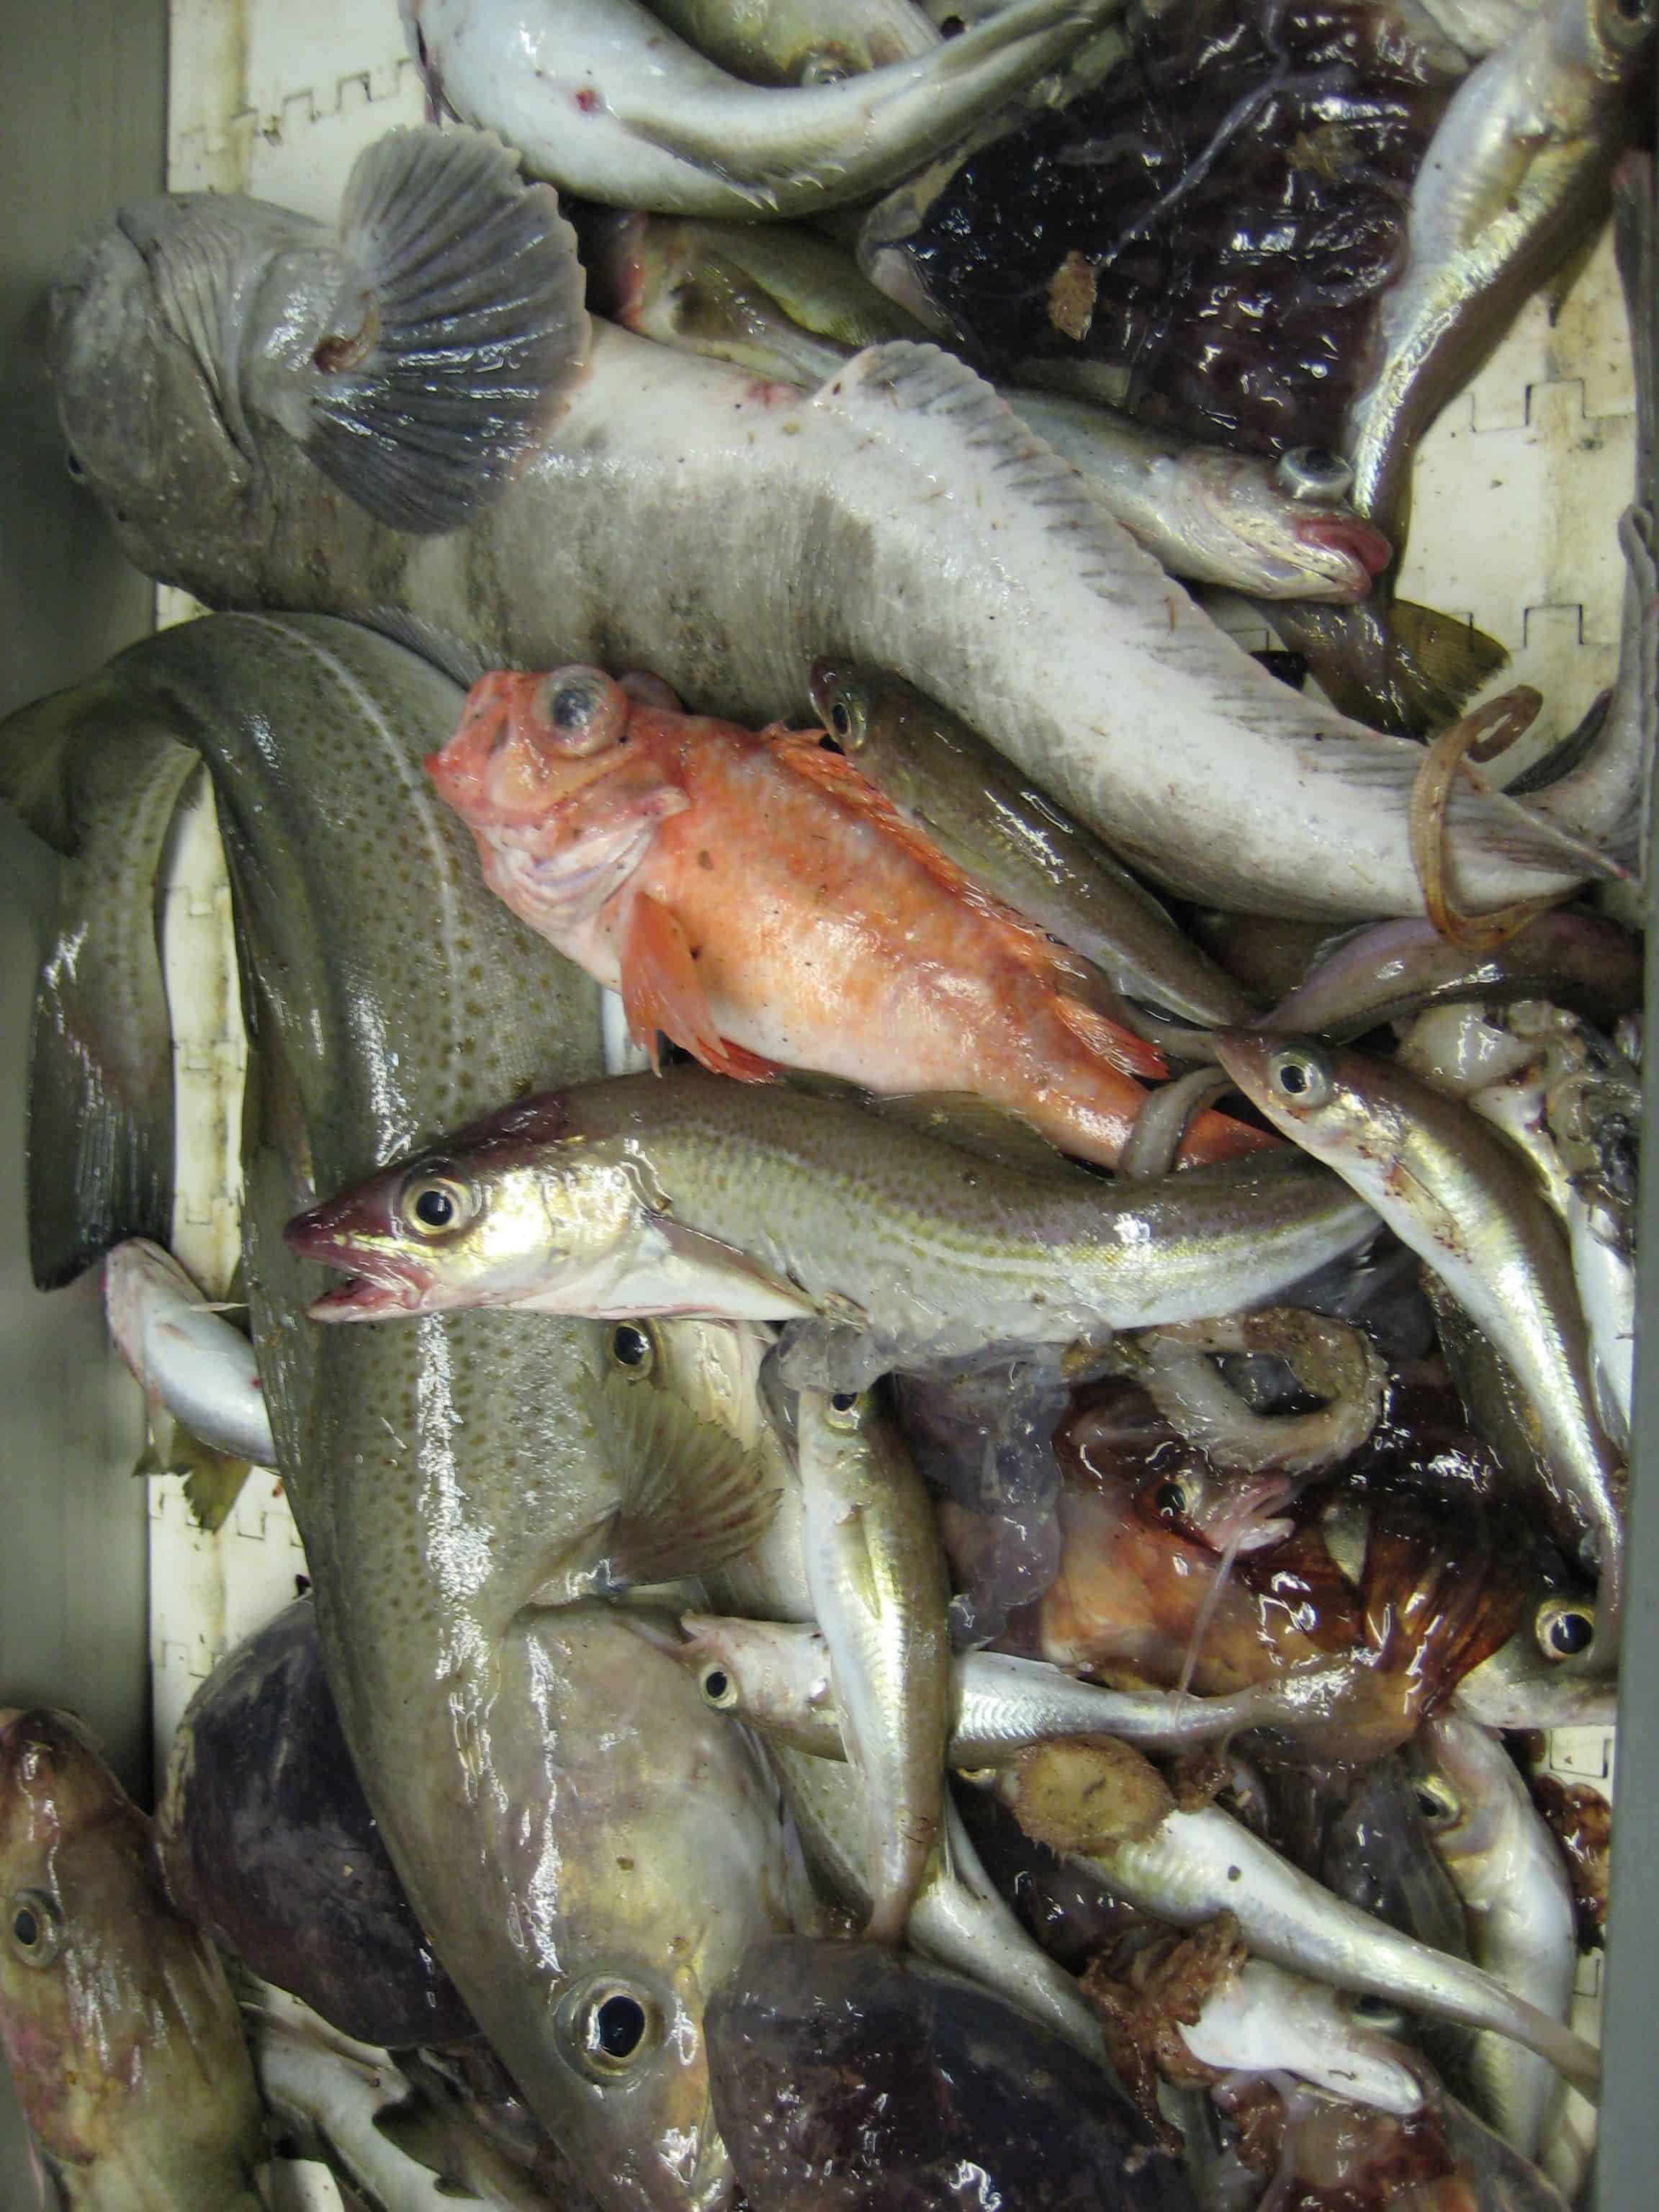
Photo of Atlantic cod and other fish species

Back in the early 1900s British scientist Walter Garstang and Germany’s Friedrich Heincke discovered that plaice in the North Sea swam deeper as they grew bigger. This trend was found in many other species of fish and became known as Heincke’s law.

Now a team from Canada has discovered that the “law” may not be due to fish biology but instead down to fishing. The Canadians’ interest began through recent reports that marine fish are heading deeper and moving north because of climate change. These studies, however, did not consider the bigger-deeper trend, which puzzled Kenneth Frank of Bedford Institute of Oceanography, Canada.

Initially, Frank and his colleagues reasoned that reduced fishing pressure in many areas of the ocean may have permitted fish to live longer and grow bigger, so that they would move deeper.

“But we also realized that most commercial fishing operations prefer to capture bigger fish – as well there are often minimum size regulations – and to fish in the most productive areas, such as on banks or plateaus that are relatively shallow,” says Frank. “All fishermen know about the importance of banks and the high catches they can yield relative to other ocean areas.”

The researchers decided to look at the role that size-selective fishing, i.e. targeting larger fish, could play in the distribution of commercial species. They used data on the depth distribution by age of Atlantic cod on Canada’s Scotian Shelf, to the southwest of Nova Scotia. There have been scientific surveys here every year since 1970.

“Virtually all the fish species that exhibit the bigger-deeper trend are targeted by commercial fishing,” says Frank. “As a result of their commercial importance, such species tend to have long-term, readily available data describing their distribution and abundance.”

The data from the Scotia Shelf indicated that cod swam deeper by about 100 m over the course of their lives, according to Frank. But the team found that the commercial fishing itself could have altered the distribution of the fish by size and age.

“We discovered that a simple population model that simulated the behavior of the fishery – in terms of selectively capturing older fish in shallower water – reproduced the depth distribution of cod that was observed during the scientific surveys,” says Frank. “The agreement between the model results and the field observations were stunning.”

Intensive fishing took place on the Scotian shelf until cod stocks collapsed in the early 1990s; the Canadian government imposed a moratorium in 1992.

“When there was no fishing, the bigger-deeper trend was not evident,” says Frank of the Scotian Shelf data. “Rather, adult cod of all age groups occurred at similar, rather shallow depths located on the productive banks. There was a suggestion of deepening among the younger cod – two and three year olds – amounting to about 10 m but beyond that age, up to age 12, no change in depth was evident.”

This indication that when there’s no fishing, Heincke’s law does not apply to older fish has several implications.

“There is a vast literature attempting to explain both the ecological and evolutionary significance of the bigger-deeper trend that we, as a scientific community, will want to revisit,” says Frank. “Further, the many recent studies that have interpreted deepening as a response to climate change need to be tempered by the fact that these studies did not consider age or sizes of any of the species. Moreover, the effects of fisheries exploitation were not considered.”

Frank believes that all future studies of changes in the distribution of marine and freshwater fishes must factor in the effects of selective fishing while addressing the potential role of climate change and habitat preferences. “It is not sufficient to look just at one factor in isolation from the others,” he says.

Now the team plans to look at the depth distribution patterns of haddock, pollock and silver hake. “These other species have different life styles and different types of fisheries exploiting them so we will modify our population models,” says Frank.

The researchers are also interested in the repercussions of removing fish from depths they would normally occupy. “When subjected to high fishing pressure it is possible that older/larger fish living in deeper water may be experiencing food shortages or possible metabolic stresses which may influence their reproductive capacity and ultimately their survival,” says Frank. “One might consider this a ‘depth sentence’ as a by-product of size-selective fishing.”

Frank and colleagues reported their findings in PNAS.

Intellectual property

You may or may not have been aware, but 26 April was World Intellectual Property Day. Observed annually, the event was set up by the World Intellectual Property Organization to “raise awareness of how patents, copyright, trademarks and designs impact on daily life” and “to celebrate creativity, and the contribution made by creators and innovators to the development of societies across the globe”.

Intellectual property (IP) has played a big part in most of my previous Transactions column, just as it has in most of the businesses I have been involved in. IP – alongside skilled, educated people and “know-how” – is key to ensuring that the efforts put into research and development benefit those who create it.

In my March column, I examined the roles played by Joseph Swan and Thomas Edison in developing lighting technology, and how having a patent early but not acting on it lets others duplicate and surpass your developments to win the commercial race. Last month, meanwhile, I described how both Ted Maiman and Gordon Gould had good claims to have invented the laser. Gould, however, would appear to have had poor advice, because he didn’t patent his idea, incorrectly believing that he needed to demonstrate a working device first.

TV stars

Another great IP battle was over the invention and commercialization of television (TV). The first working TV system was demonstrated by Scottish inventor John Logie Baird on 26 January 1926. However, the first mechanical television system was not terribly practical – in short it was not something you could put in your home. It did, though, demonstrate the potential of the new technology.

The race to develop a practical electronic TV system took place between the US-born inventor Philo Farnsworth and the Radio Corporation of America (RCA). It was a David and Goliath story spanning 15 years and involving patents, lawsuits, schoolteachers, financial might and some less-than-ethical practices. The battle also nearly broke Farnsworth.

Born in Utah in 1906, Farnsworth came up with the concept for the electronic TV as a 14-year-old schoolboy watching the way crops were sown and harvested on his family’s farm – line by line, in what became known as raster scanning. By 1927 he had filed patents on his technology and worked on his invention enough to secure investment. And by the early 1930s Farnsworth had developed working systems and formed a partnership with a radio manufacturer called Philco to bring it to market.

Although it might seem odd why anyone would want to buy a TV at this point as there was nothing to watch, RCA saw the potential. Founded in 1919 as a wholly owned subsidiary of General Electric, RCA was a major manufacturer of radio receivers. It had set up the US national radio broadcasting network (NBC) and owned more than 2000 radio technology patents.

Under the leadership of its general manager David Sarnoff in the 1930s, however, RCA changed its business model. The firm turned its competitors – rival manufacturers who were then making 75% of all radio receivers – into its customers by licensing its own patents to them. RCA could therefore make money both from licensing technology and from the broadcast services that provided the content that fuelled the demand for the hardware.

Sarnoff saw the threat of TV to his radio empire – but also the opportunity it presented. RCA therefore started investing massively in development, hiring Vladimir Zworykin (a talented inventor and engineer from Westinghouse) who had patented an electronic TV concept in 1923. RCA flexed its might via its radio patent-licence agreement and Philco stopped working with Farnsworth. And when Sarnoff tried to buy the patents and Farnsworth refused, RCA used its financial and legal might to try to claim priority of the Zworykin patent.

The legal fight, which began in 1933, dragged on for 15 months with the core of the case being whose patent contained a viable working electronic television system. In the end it was Farnsworth’s high-school science teacher’s testimony and a 1922 sketch that won the case. It was not, though, the end of the story. RCA filed costly appeals to drain Farnsworth’s coffers, hoping to keep the case in court until the patents ran out. The firm also tried to create a workaround for Farnsworth’s patents to make a viable TV, developing a great product that was launched in 1939 at the New York World’s Fair.

The killer blow

Unfortunately for RCA, it used elements of Farnsworth’s design. Despite having tried to work around the Farnsworth patents for years, in 1939 Sarnoff eventually agreed to license Farnsworth’s patents to put the best product on the market. But once America entered the Second World War in 1941, all manufacturing was dedicated to the war effort, which halted production of the TV.

The killer blow for Farnsworth occurred in 1946 when his patents expired. RCA jumped at the fact that anyone could now use his technology, creating the first TV network from its radio network NBC and selling 10 million of its TV sets in the US in just three years. By the end of the 1950s, television had become the world’s most popular form of entertainment.

In all these stories there is a key message to inventors and innovators: get good IP advice early on

James McKenzie

In all these stories there is a key message to inventors and innovators: get good IP advice early on. And if any of this has struck a chord with you, you might be interested in an event at the Daresbury Laboratory in the UK on 22 June, organized by the Business Innovation and Growth Group of the Institute of Physics, which publishes Physics World. Entitled “IP and why you need to know about it”, it should be an invaluable guide especially to those working in small firms, covering details of how the patent system works and how to get patent coverage for your ideas.

Spotting submarines from the air: the June 2018 issue of Physics World is now out

Cover of the June 2018 issue of Physics World

How can you use sound to locate submarines from the air? That’s the question tackled in the cover story of the new issue of Physics World magazine, which is now out. Marking the centenary of the Royal Air Force (RAF), the feature has been written by Jason Furlong from the Royal Canadian Air Force and John Ryder – an RAF pilot who studied physics and is a long-standing member of the Institute of Physics (IOP), which publishes Physics World.

Much of the challenge focuses on analysing the strange and complex behaviour of sound in what is a noisy underwater world. Maritime patrol aircraft crews do this by dropping sonobuoys containing hydrophones at strategic points to record signals and send them back to a transceiver on the plane. It’s the crew’s job to then analyse the complex data using mathematical models to pinpoint a sub’s location.

Elsewhere in the issue, find out how the first trillionaire could be made in space, possibly by mining an asteroid, and discover why some cosmologists still aren’t sure if dark energy is the right explanation for the accelerating universe. Plus we look at the importance for inventors of acquiring intellectual-property rights and find out why applying for grant money is still so hard.

Remember that if you’re a member of the Institute of Physics, you can read the whole of Physics World magazine every month via our digital apps for iOSAndroid and Web browsers. Let us know what you think about the issue on TwitterFacebook or by e-mailing us at pwld@iop.org.

For the record, here’s a run-down of what else is in the issue.

• Physicists target the dark photon – An Italian experiment is to hunt for hypothetical particles that could carry a fifth force, as Edwin Cartlidge reports

• New NASA boss divides opinion – Jim Bridenstine’s appointment as the next head of NASA has garnered praise and disapproval, as Peter Gwynne reports

• The power of images – Enrico Sacchetti argues that the saying “a picture is worth a thousand words” is truly apt when it comes to the photography of large physics
experiments

• What is physics like? – Robert P Crease wants to know your most discerning metaphor for doing physics

• Intellectual property – James McKenzie reflects on the importance of intellectual property, which is a key part of commercializing technology

• The dark-energy deniers – The discovery that the universe is expanding with increasing speed may have bagged a Nobel prize, but some cosmologists are still not sure if dark energy is the explanation for it. Keith Cooper looks at the arguments for and against this mysterious phenomenon

• Hunting submarines from the air – Far above the ocean’s surface, aircraft hunt for an unseen enemy below the waves. To mark the centenary of the Royal Air Force, tactical co-ordinator Jason Furlong and pilot John Ryder describe how they use physics to find submarines

• The asteroid trillionaires – The race to the riches of asteroids is on, with several private companies vying for funding to become the first space miners. Andrew Glester digs into the issues involved in making money from asteroids

• Riding the gravity wave – Benjamin Skuse reviews On Gravity: a Brief Tour of a Weighty Subject by Anthony Zee

• The wow and the woo – Philip Moriarty reviews Quantum Sense and Nonsense by Jean Bricmont

• The perils of proposals – With its complex procedures, unknown evaluations and unconscious biases, applying for research funding is no mean feat. Dalmeet Singh Chawla investigates if it is time to revamp the grant-funding process

• Once a physicist – Meet Arie van ’t Riet an artist in the Netherlandswho uses X-ray equipment to create “bioramas” X-ray portraits of animals and plants

• Reality science – Jeremy Baumberg on dystopian future science funding

Portable magneto-optical device can detect malaria rapidly

A portable, magneto-optical device that rapidly detects the early stages of malaria infection has been created by Andrea Armani of the University of Southern California and colleagues. It analyses blood samples by moving magnetic nanocrystals created by the parasite away from a laser beam, detecting changes in the light passing through the sample if the magnetic substance is present. The scientists say this technique allows them to identify early changes in the blood of someone infected with malaria, regardless of the parasite strain.

Malaria is a major global health problem. In 2016 there were an estimated 216 million cases in 91 countries, resulting in 445,000 deaths, according to the World Health Organization. Most of the burden of this mosquito-borne infectious disease, caused by Plasmodium parasites, falls on the developing world. In 2016 Africa was home to around 90% of malaria cases and deaths.

Early diagnosis is key to effective malaria treatment and helps reduce transmission. The two most common tests are microscopy and antibody-based diagnostic tests, but both have their limitations. Identifying malaria-causing parasites in blood samples using a light microscope is the diagnostic standard, but this can be slow, and it relies on good-quality equipment and well-trained technicians. Poorly done microscopy is a well-known problem in malaria diagnostics.

Rapid diagnostic tests (RDT) detect malaria antigens in a small sample of blood placed on a test strip, giving results in around 15 min. There are many different RDTs, however, and they vary in quality and some ideally need to be kept refrigerated. Also, most do not test for all strains of malaria – they target different antigen combinations depending on the local epidemiology.

Magnetic byproduct

Armani and colleague’s magneto-optical device detects haemozoin – a by-product created by all species of malaria parasite. The team says by focusing on haemozoin, their test can rapidly detect the early stages of infection for all malaria strains.

The prototype, described in ACS Sensors, can detect levels of a haemozoin mimic in rabbit blood that correspond to around 26 parasites/μL. According to the researchers, this is below the level at which there would be symptoms of disease, and comparable to, or better than, current malaria tests.

The device is the size of a shoebox, weighs less than 5 kg and can be powered by a battery for 8 h. It also works with whole blood samples without the need for added chemicals, which may have strict storage requirements. The researchers say that these attributes make it ideal for use in low-resource environments.

We design with the goal of making instruments that can be dropped from planes, operated with minimal power and are very lightweight

Andrea Armani

“All of my research is funded by the military, so my lab takes a very different approach to designing diagnostic systems,” Armani explains. “We design with the goal of making instruments that can be dropped from planes, operated with minimal power and are very lightweight.”

Haemezoin is produced when the malaria parasite digests haemoglobin, a component of red blood cells and its primary nutrient source. As the parasite feeds on haemoglobin it creates haem, an iron-containing compound that is toxic to the parasite. To tackle this, the parasite converts haem into an insoluble crystalline form called haemozoin. This substance is a prime target for a magneto-optic diagnostic system because it is good at blocking light. It is not usually present in blood and crucially, unlike all other components of blood, it is magnetic.

Pulled to one side

The device comprises a laser, a light detector and a magnet. When a blood sample is placed in the device, the detector measures how much light from the laser passes through the blood. The magnet is then switched on and if haemozoin is present it is pulled out the laser beam. This causes the amount of light reaching the detector to increase.

Armani told Physics World that the team is now looking to reduce the sample volume required for the test from 5–7 drops of blood to 1–2 drops. This would allow finger prick testing, as well as working on further trials as a precursor to field tests.

“The current prototype demonstrated can detect early-stage infection,” Armani says. “Conservatively, the earliest part of the early-stage infection window begins 48–72 h after infection. However, our ultimate goal is to detect within the first 24–48 h.”

This is not the first time that a magneto-optical malaria detector has been proposed. In 2014 physicists in Hungary developed a prototype that used a somewhat different detection process.

New patient immobilization mask material 

Orfit Industries’ polymer science group has harnessed the power of nanotechnology to help improve cancer treatment. Nanor, a thermoplastic material enhanced with nanoparticles, has been developed to precisely immobilize patients during cancer treatment using radiation therapy. Limiting the movement of the patient results in more targeted treatment delivery and the potential for improved patient outcomes.

Nanor is the thinnest and strongest material that has so far been used for immobilization during cancer treatment. The nanoparticles increase the strength of the thermoplastic mask material, which helps to limit patient movement while allowing precise targeting of the tumor. Because the material is so thin, the Nanor mask fits on the patient like a surgical glove. It adapts perfectly to the patient anatomy, contributing to limitation of movement, increased comfort and accurate treatment delivery resulting in improved patient outcomes.

Nanor Thermoplastic is FDA 510(k) cleared and is available as part of the High Precision Patient Immobilization Systems available in North America and worldwide.

For more information about Nanor thermoplastic immobilization, visit www.orfit.com/nanor

Human organoids go digital

Radio frequency identification (RFID) chips can be used to keep track of human organoids, according to new experiments by researchers in the US and Japan. Combining organoids (which are samples of human tissue grown from stem cells that mimic organs) with digital technology in this way could prove useful for advancing drug testing and monitoring transplant patients.

RFID is a cost-effective technology that is widely used in applications as diverse as train and bus passes, toll-collection on highways, livestock tracking and clothing tags to deter shoplifters. In 2017, the world RFID market was estimated to be worth US$11.2 billion and it is expected to grow by 10% annually.

In recent years, researchers have been looking to employ RFID in healthcare. Medical applications now include an oral “digital pill” to monitor some chronic conditions. This device emits radio frequency signals that can be sent to a smartphone or other device in real time, thus providing important data to help a patient take the appropriate medications at the right moment.

Embedded RFID chips

A team led by Takanori Takebe of the Cincinnati Children’s Hospital Medical Center, Tokyo Medical and Dental University and Yokohama City University has now done something completely different and has embedded RFID chips into human organoids for the first time.

Organoids can be thought of organs in miniature. They are increasingly being employed in biomedical research for studying diseases since they have the same structure, function and phenotype as human organs. This is because they are grown from induced pluripotent stem cells (iPSCs), so they divide, differentiate and self-assemble in the same way as the iPSCs themselves. As such, they can be used to test the effects that certain drugs have on our organs in ways that more traditional cell cultures can’t.

The researchers introduced RFID chips into organoids by taking advantage of natural cavitation processes that take place when organoids self-assemble into 3D structures during growth. “In this way, we succeeded in introducing the RFID microchips without disturbing the organoids,” says Takebe. “We did this by mixing the chips with a cell culture inside a gel.”

Technique tested on liver organoids

The team tested out its technique on liver organoids containing commercially available RFID chips 0.4 mm in size. The organoids were grown from 10 different iPSC lines from both healthy and diseased donors.

“We found that 95% of the 96 test organoids successfully incorporated the chips,” says Takebe. “The organoids were undamaged by the procedure and were shaped normally, secreted normal liver proteins and transported bile as expected.

“Surprisingly, there were almost no differences between organoids containing a chip and those without,” he tells Physics World.

The researchers used the RFID chips to measure lipid accumulation in organoids grown from healthy iPSCs and those grown from iPSCs taken from patients with fatty liver disease. They were able to distinguish between both groups in their experiments.

RFID chips are robust

“Although we have only introduced RFID microchips into organoids so far, I imagine that we could also embed other types of micro-devices using our technique,” says Takebe. “In this way, we could potentially sense, record and track different types of behaviour in live organoids. This would open new avenues in drug testing, advanced biological studies and even post-transplant tracking.”

RFID chips are known to be robust and, not surprisingly, they remained so in the organoids tested. For instance, they continued to function normally after being frozen to temperatures of nearly -200°C and then thawed, embedded in paraffin and at a range of different pHs. “These are all the types of conditions they might need to survive in to be useful in research,” explains Takebe.

The researchers, reporting their work in iScience 10.1016/j.isci.2018.05.007, say that they will now try to produce the hybrid organoids on a larger scale. “We are working on integrating a high-speed printer to do this. We are also looking to develop a system that can scan organoid radio frequency and fluorescence signals at the same time for real-time monitoring of the structures.”

Copyright © 2026 by IOP Publishing Ltd and individual contributors