Study reveals the energy cost of Hannibal’s Alpine crossing
The Col du Clapier route would have been the more energetically favourable
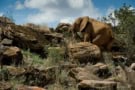 Read article: Study reveals the energy cost of Hannibal’s Alpine crossing
The Col du Clapier route would have been the more energetically favourable
Read article: Study reveals the energy cost of Hannibal’s Alpine crossing
Exploration of quirky Nobel prizes bags ABSW award
 Read article: Physics World’s Margaret Harris honoured for ‘Feature of the Year’
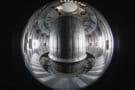
Mirror Moon has been created by the British artist Luke Jerram
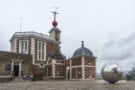 Read article: Stunning Moon sculpture unveiled at Royal Observatory Greenwich
The new technique offers a new way to tackle art fraud
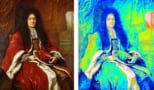 Read article: Fractal maths helps distinguish genuine artworks from forgeries
The work is an important step to understanding the physics of “negative triangularity”
 Read article: Research on magnetic plasma confinement wins Plasma Physics and Controlled Fusion Outstanding Paper Prize
Is the controversy settled? Only when pigs – and pilot waves – fly, writes Tim Wogan
 Read article: Experiment that may or may not disprove Bohmian mechanics continues to spark debate
Matin Durrani reports from a meeting of the London Quantum Cluster
 Read article: Quantum influencers gather to celebrate London’s role in quantum tech
The team says it is the first demonstration of 'Voronoi patterns' in plants
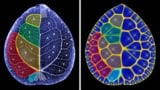 Read article: Striking mathematical pattern uncovered in Chinese money plant leaves
Mićo Tatalović vists the former site of Cambridge University’s physics department before it is demolished
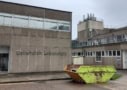 Read article: Final look inside the Cavendish lab’s 50-year home before demolition
The fibre robot could find applications in agriculture and reforestation
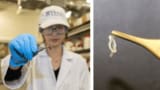 Read article: Tiny knotted fibre leaps into the air like a springtail bug