

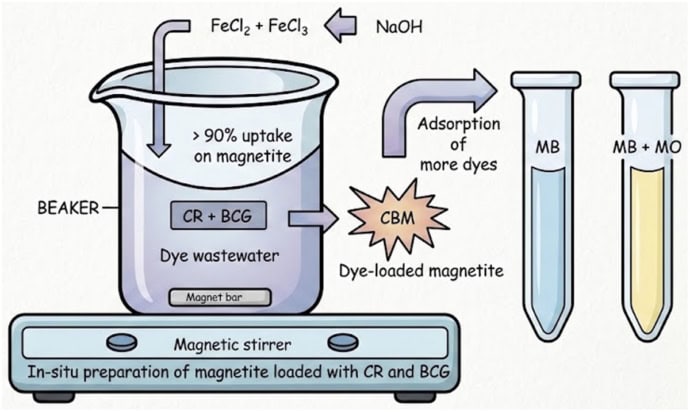
Synthesizing magnetite nanoparticles directly in dye-polluted water gives them new surface chemistry that lets them adsorb different pollutants
Join the audience for a live webinar at 4 p.m. GMT/5 p.m. CET on 3 November 2026
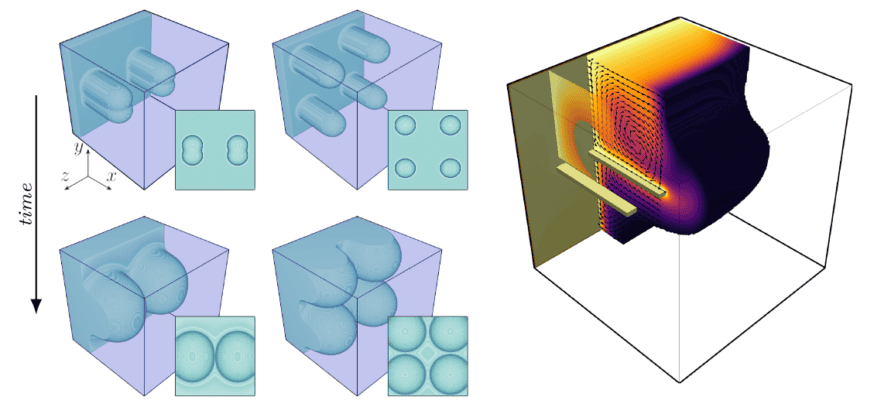
Nanostructured device efficiently transforms light into different frequencies – including those at technologically important near-infrared wavelengths
 Read article: Metasurface optical device boosts nonlinear frequency conversion
New concept exploits both the heat of the Sun and the coldness of outer space
 Read article: A hybrid energy system for heating, cooling and generating electricity
New finding could help create active matter with a structure that continuously reorganizes itself
 Read article: Non-reciprocal interactions keep particles in collective motion
An unexpected material comes to the rescue of 2D material transfer
 Read article: Cling film helps stamp two-dimensional materials onto patterned surfaces
A 2D magnetic material exhibits a charge-ordered state in which electrons move collectively and unusually slowly while maintaining quantum coherence
 Read article: Two-dimensional material shows promise for long-term memory, thanks to slow electrons
“Re-entrant” superconductivity discovered in a 2D material for the first time
 Read article: Magnetic field first kills superconductor, then brings it back to life
Explore our interactive quizzes, word games, crosswords and more.

The applied scientist Lin Ma is our podcast guest
 Read article: Creating better batteries for electricity grids
Robert P Crease discovers the true extent of materials science in a dental lab
 Read article: Get your teeth into the cutting edge of materials science
Bringing measurements across time, space and spectrum together is revealing the hidden dynamics of innovative optoelectronic devices and novel semiconductor materials
 Read article: Above-average correlative materials characterization
Marco Caffio, the co-founder of iGii, is our podcast guest
 Read article: Porous material offers the benefits of graphene in 3D
Discover how molecular imprinting enables selective electrochemical sensors for next-generation chemical detection
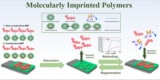 Read article: Advances in molecularly imprinted polymers for electrochemical sensing
The nanostructures can be incorporated into wearable eyeglasses
 Read article: Upconverting colloidal quantum dots bring ‘colour vision’ to the infrared
Researchers incorporate a heat blocking technology into the solar cells onboard remote uncrewed aerial vehicles
 Read article: Semiconducting nanorods help laser-powered drones keep cool
Eventual goal is electronic devices that can reconfigure and even repair themselves
 Read article: ‘Kinetic electronics’ make self-connecting circuits
Rapid cooling locked in unusual crystal structure in silicon-rich metal alloy
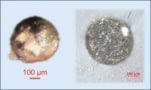 Read article: New material was created in Hiroshima nuclear explosion
Extending the lifetime of electric-vehicle batteries could reduce the need for mining critical minerals
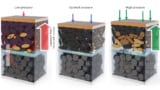 Read article: Pressurizing EV battery electrodes could make them last longer, if it’s done right
Boundary between materials that flow and those that don’t could shed light on Earth’s early history
 Read article: Geophysicist identifies a maximum practical viscosity
New finding could help improve technologies such as on-chip cooling and thermophotovoltaic systems
 Read article: Metamaterial boosts heat transfer on the nanoscale
Previously unknown pathway involving superhydrophobic surfaces could influence the development of new anti-icing techniques
 Read article: Frost spreads across surfaces via suspended ‘ice bridges’
New artificial vision system adapts faster to changing light conditions
 Read article: Machine vision begins to work like the human eye
Device based on two-dimensional oxide interface superconductors can be “edited” using atomic force microscope lithography
 Read article: New superconducting diode gives greater control over the flow of electrons
New device produces higher-resolution X-ray images using a much lower dose of radiation
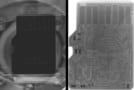 Read article: Mouldable glass screen could make mammograms clearer and much more comfortable
New technique allows researchers to probe the top layer of an atomically thin topological quantum material for the first time
 Read article: Encapsulation enhances surface structure imaging of 2D quantum material
"Proximity effect" appears in models of semiconductor/altermagnet bilayer structures
 Read article: Altermagnets can turn neighbouring materials altermagnetic, too